
The 1994 Northridge earthquake generated world-record ground motions. At the time, the horizontal peak ground acceleration of 1.8 g measured by a seismometer in Tarzana was the largest ever. The same is true of the peak ground velocity of 148 cm/s measured in Granada Hills. Both measurements were within approximately 15 km of the source of the earthquake; they were also near most of the damage described in other articles of this series. Consequently, the near-source design forces from the seismic zone maps in the Uniform Building Code (UBC) were increased. From the 1994 to 1997 editions, acceleration- and velocity-related near-source factors were introduced. The factors increased the design forces in Zone 4, already the highest seismic zone, by a multiplier as large as 2.0. More enduringly, generational changes were made to the seismic design maps in the NEHRP Recommended Seismic Provisions for New Buildings and Other Structures. The NEHRP maps were – and continue to be – adopted into the International Building Code (IBC), which supplanted the UBC and other model building codes. As described below, the changes to the NEHRP maps took advantage of another post-Northridge change: the modern generation of U.S. Geological Survey (USGS) National Seismic Hazard Maps.
Changes to Seismic Design Maps in Model Building Codes
Before the Northridge earthquake, the NEHRP Provisions (1994 and preceding editions) provided maps of effective peak acceleration, Aa, and effective peak velocity-related acceleration, Av. Such maps were also used by two of the three model building codes of the time, the National Building Code (1993 edition) and the Standard Building Code (1994 edition). Even the seismic zone map in the UBC (1994 edition), shown in Figure 1, was derived from an Av map. All of these maps were based – with some modifications, updates, and simplifications – on the Aa and Av maps first introduced in the 1978 Tentative Provisions for the Development of Seismic Regulations for Buildings, also known as ATC 3-06. In turn, these seismic design maps were loosely based – with truncations, modifications, and approximations – on a USGS peak ground acceleration (PGA) fully probabilistic hazard map published in 1976. For more information on pre-Northridge seismic design and hazard maps, a good reference is USGS Spectral Response Maps and their relationship with Seismic Design Forces in Building Codes.
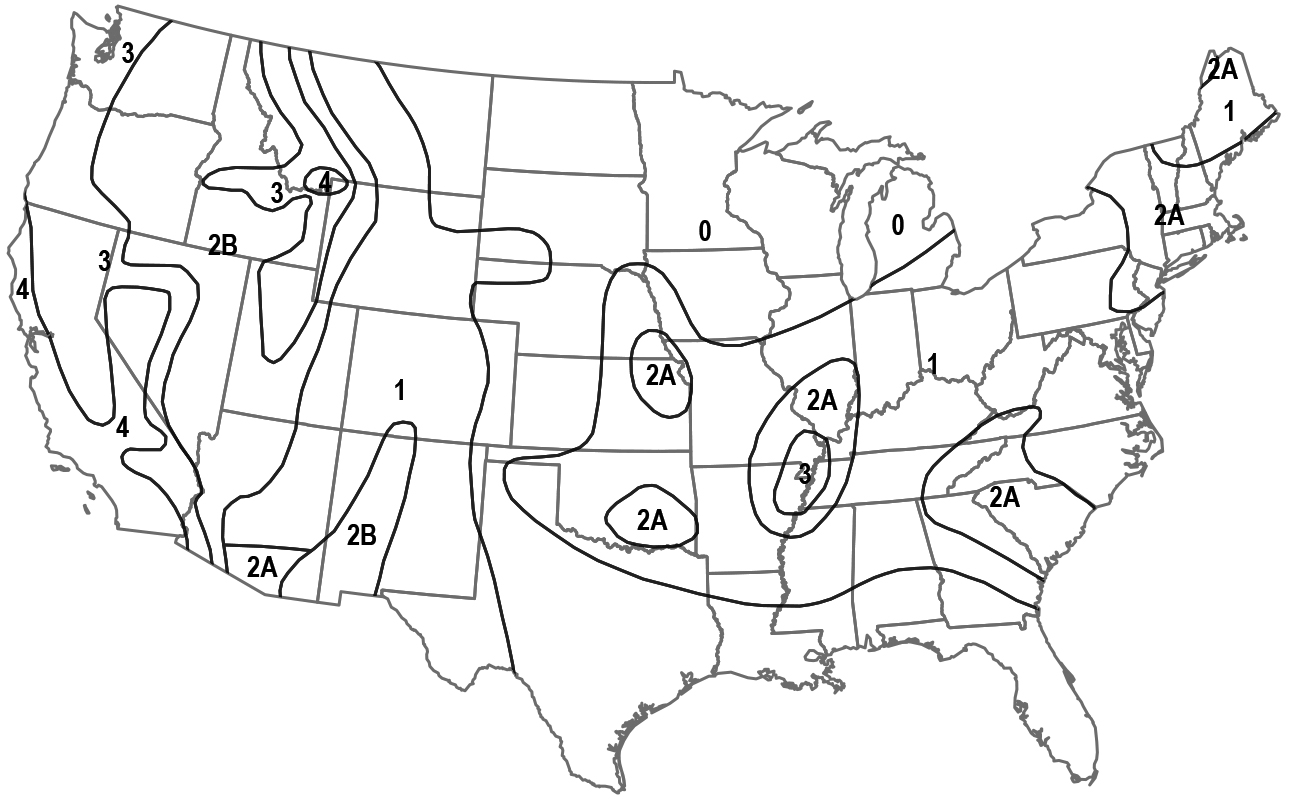
Figure 1. Seismic zone map of the 1994 Uniform Building Code (redrawn from the original by Kenneth Rukstales of the USGS).
In the 1997 edition of the NEHRP Provisions, the seismic design maps changed to the short-period and 1-second spectral response acceleration parameters, SS and S1. These parameters are more closely related to the seismic response of structures. The new maps became more directly based on the USGS National Seismic Hazard Maps. These changes resulted from Project ’97, a collaboration between the developers of the NEHRP Provisions (i.e., the Building Seismic Safety Council, BSSC, with funding from the Federal Emergency Management Agency, FEMA) and the USGS. Project ’97 also changed the seismic design maps from a nominal hazard level of 10% probability of exceedance in 50 years to 2%-in-50-year ground motions factored by two-thirds. However, this change was largely driven by 19th-century earthquakes in the central and eastern United States. Like pre-1997 seismic design maps, the Project ’97 maps continued to truncate the probabilistic USGS National Seismic Hazard Maps. The pre-1997 maps were truncated at a PGA of 0.4 g. Above the roughly corresponding spectral response accelerations (i.e., wherever SS>1.5 g and S1>0.6 g), the Project ’97 maps were capped with newly defined deterministic ground motions. In some cases, these capped ground motions of the 1997 NEHRP Provisions were even larger than those corresponding to the near-source factors of the 1997 UBC.
All of the Project ’97 changes described above have persisted through the seismic design maps used today, with some additional modifications. For more information on Project ’97, a good reference is a journal publication titled Development of Maximum Considered Earthquake Ground Motion Maps. The 1-second (S1) map from Project ’97 is shown in Figure 2. In addition to the 1997 NEHRP Provisions, the Project ’97 maps were later adopted into the 1998 ASCE 7 standard (Minimum Design Loads and Associated Criteria for Buildings and Other Structures) and the 2000 edition of the IBC. Ten and twenty years later, Project ’07 and Project ’17 resulted in additional changes reflected in the current (2015 NEHRP Provisions) and proposed next-generation (2020 NEHRP Provisions) seismic design maps.
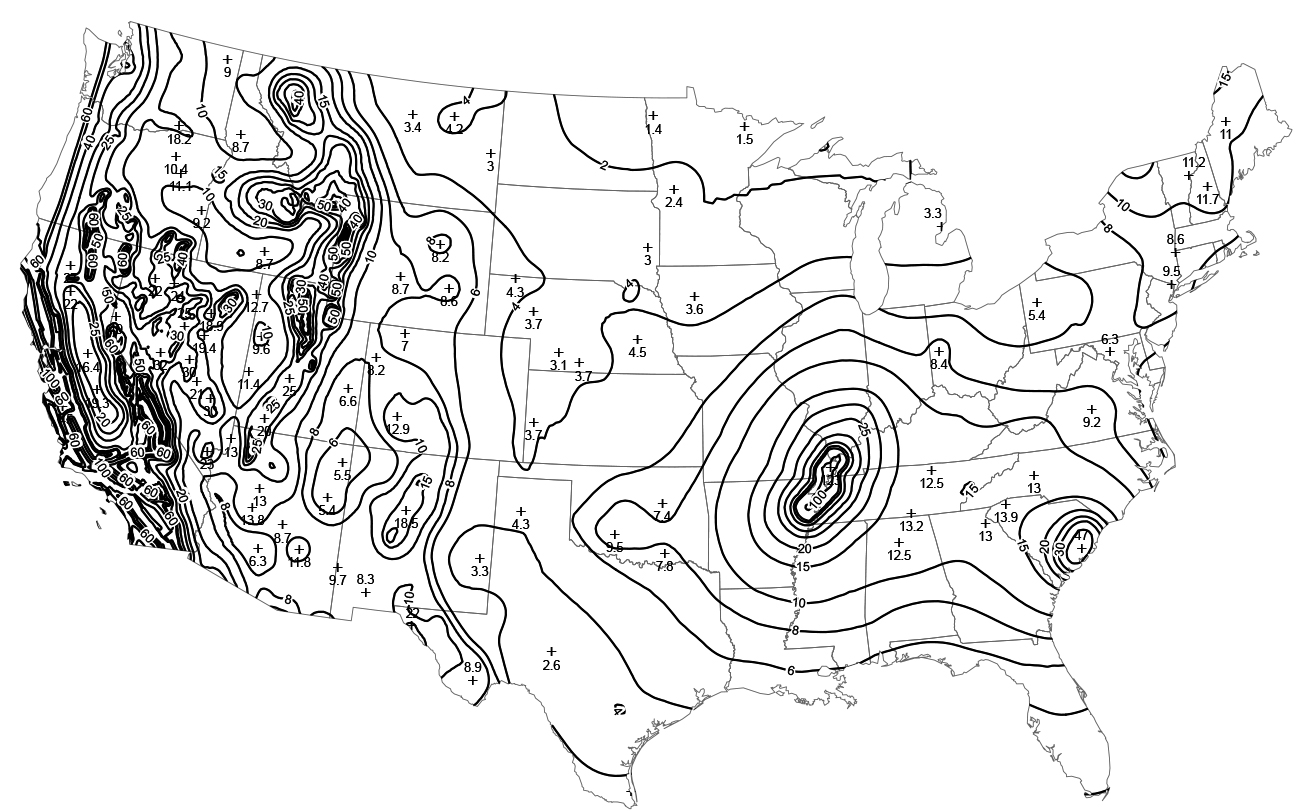
Figure 2. Seismic design map of the 1997 NEHRP Provisions providing spectral response accelerations, in units of %g, at a period of 1 second (redrawn from the original by Kenneth Rukstales of the USGS).
Changes to USGS National Seismic Hazard Maps
The USGS has developed National Seismic Hazard Maps since 1976, after publication of the Probabilistic Seismic Hazard Analysis (PSHA) approach. However, the modern generation of the USGS maps began in 1996, after the Northridge earthquake. The modern maps have benefitted from engagement of the earthquake science and engineering communities through workshops and public comment periods. For example, from 1994 to 1995, the USGS convened six regional workshops for the 1996 National Seismic Hazard Maps. The workshops resulted in substantial modifications to the methodologies used. After posting interim maps on the Web in 1995, additional comments on the methods led to further modifications. A similar process has been followed for the 2002, 2008, 2014, and 2018 updates of the USGS maps.
Also persisting through the more recent USGS updates, several scientific advancements were made for the 1996 National Seismic Hazard Maps. First, about 500 faults in the western United States were added, including the Northridge fault. Their earthquake occurrence frequencies (required for probabilistic hazard mapping) were estimated from fault slip rates or trenching studies. Second, spatially smoothed historical earthquake locations supplemented the broader zones of seismicity modeled in previous USGS maps. Such smoothed seismicity is used to capture the hazard from undiscovered sources of earthquakes, like the Northridge blind thrust fault that was revealed by the 1994 earthquake. Third, alternative models of seismic hazard were included in a logic tree formalism. This is now common practice in order to represent the modeling uncertainty inherent in seismic hazard mapping. For more information on the 1996 USGS National Seismic Hazard Maps, see its documentation and/or Appendix B of the commentary of the 1997 NEHRP Provisions.
Other changes to the USGS National Seismic Hazard Maps that were initiated by the 1994 Northridge earthquake came to fruition after the 1996 maps. For example, the 2002 USGS maps applied five new models of ground motion attenuation that made use of data from the Northridge earthquake; the 1996 maps used three such models that predated the 1994 earthquake. From two of the new ground motion models, so-called hanging wall terms for thrust (like Northridge) or reverse earthquakes were used in the 2002 maps. At one of the USGS workshops convened for the 2002 update, the community suggested including the phenomenon of near-source earthquake rupture directivity observed in the Northridge earthquake. Due to the computational requirements of doing so, and the dearth of published literature on approaches, directivity effects were not explicitly included in the 2002 maps. Even now, explicit inclusion of directivity remains a goal for future USGS updates.
Summary and Other Ongoing Changes
Seismic design maps in model building codes, and the fully probabilistic USGS National Seismic Hazard Maps upon which they are based, have come a long way since ATC 3-06 (1978) and the 1976 USGS maps. Earthquakes like the 1994 Northridge event have taught new lessons and prompted changes from previously learned lessons. In particular, the Northridge earthquake generated near-source ground motion data and other observations that improved the USGS maps. Post-Northridge seismic design maps in the NEHRP Provisions (and ASCE 7 and IBC) were also improved, by more directly basing them on the USGS updates. More recently, the 2018 USGS update has incorporated another effect observed from Northridge: amplified ground motions in deep sedimentary basins at relatively long spectral response periods. Correspondingly, Project ’17 has recommended use of USGS ground motions for periods longer than 1 second (in addition to shorter periods). These and other ongoing changes are continuously advancing model building codes. The results are structural designs more commensurate with the seismic hazard, which benefit society by balancing constructions costs and seismic risks. Even so, more data from future earthquakes are needed (e.g., on rupture directivity), and more changes to seismic design and hazard maps are to come.■
References
Chopra, A.K. (1995). Dynamics of Structures: Theory and Applications to Earthquake Engineering, Prentice Hall.
Cornell, C.A. (1968). “Engineering seismic risk analysis,” Bulletin of the Seismological Society of America, Vol. 58, No. 5.
Frankel, A.D., Mueller, C.S., Barnhard, T.P., Perkins, D.M., Leyendecker, E.V., Dickman, N.C., Hanson, S.L., & Hopper, M.G. (1996). “National Seismic Hazard Maps: Documentation,” U.S. Geological Survey Open File Report 96-532.
Frankel, A.D., Mueller, C.S., Barnhard, T.P., Leyendecker, E.V., Wesson, R.L., Harmsen, S.C., Klein, F.W., Perkins, D.M., Dickman, N.C., Hanson, S.L., & Hopper, M.G. (2000). “USGS National Seismic Hazard Maps,” Earthquake Spectra, Vol. 16, No. 1.
Leyendecker, E.V., Perkins, D.M., Algermissen, S.T., Thenhaus, P.C. & Hanson, S.L. (1995). “USGS spectral response maps and their relationship with seismic design forces in building codes,” U.S. Geological Survey Open File Report 95-596.
Leyendecker, E.V., Hunt, R.J., Frankel, A.D. & Rukstales, K.S. (2000). “Development of maximum considered earthquake ground motion maps,” Earthquake Spectra, Vol. 16, No. 1.
Petersen, M.D., Bryant, W.A., Cramer, C.H., Cao, T., Reichle, M.S., Frankel, A.D., Lienkaemper, J.J., McCrory, P.A., & Schwartz, D.P. (1996). “Probabilistic Seismic Hazard Assessment for the State of California,” U.S. Geological Survey Open-File Report 96-706.
Suzuki, A. & Iervolino, I. (2017). “Italian vs. worldwide history of largest PGA and PGV,” Annals of Geophysics, Vol. 60, No. 5.