 Jae-Hyeok Lee
 Ji Young Yun2
 Susan J. Hayflick
- 1Department of Neurology, Research Institute for Convergence of Biomedical Science and Technology, Pusan National University Yangsan Hospital, Pusan National University School of Medicine, Yangsan-si, South Korea
- 2Department of Neurology, Ewha Womans University Seoul Hospital, Ewha Womans University College of Medicine, Seoul, South Korea
- 3Departments of Molecular and Medical Genetics, Oregon Health and Science University, Portland, OR, United States
Most neurodegeneration with brain iron accumulation (NBIA) disorders can be distinguished by identifying characteristic changes on magnetic resonance imaging (MRI) in combination with clinical findings. However, a significant number of patients with an NBIA disorder confirmed by genetic testing have MRI features that are atypical for their specific disease. The appearance of specific MRI patterns depends on the stage of the disease and the patient's age at evaluation. MRI interpretation can be challenging because of heterogeneously acquired MRI datasets, individual interpreter bias, and lack of quantitative data. Therefore, optimal acquisition and interpretation of MRI data are needed to better define MRI phenotypes in NBIA disorders. The stepwise approach outlined here may help to identify NBIA disorders and delineate the natural course of MRI-identified changes.
Introduction
Neurodegeneration with brain iron accumulation (NBIA) is a group of inherited disorders with hallmark features that include abnormal iron accumulation in the basal ganglia, mainly the globus pallidus (GP) and substantia nigra (SN) (1). Ten associated genes have been identified [Table 1; (2)]. The four most common NBIA disorders include pantothenate kinase-associated neurodegeneration (PKAN), phospholipase A2-associated neurodegeneration (PLAN), mitochondrial membrane protein-associated neurodegeneration (MPAN), and beta-propeller protein-associated neurodegeneration (BPAN) (3). Recently, new candidate genes have been described with the advent of next-generation sequencing (4). However, the scarcity of cases makes it impossible to determine their relevance to NBIA disorders (5).
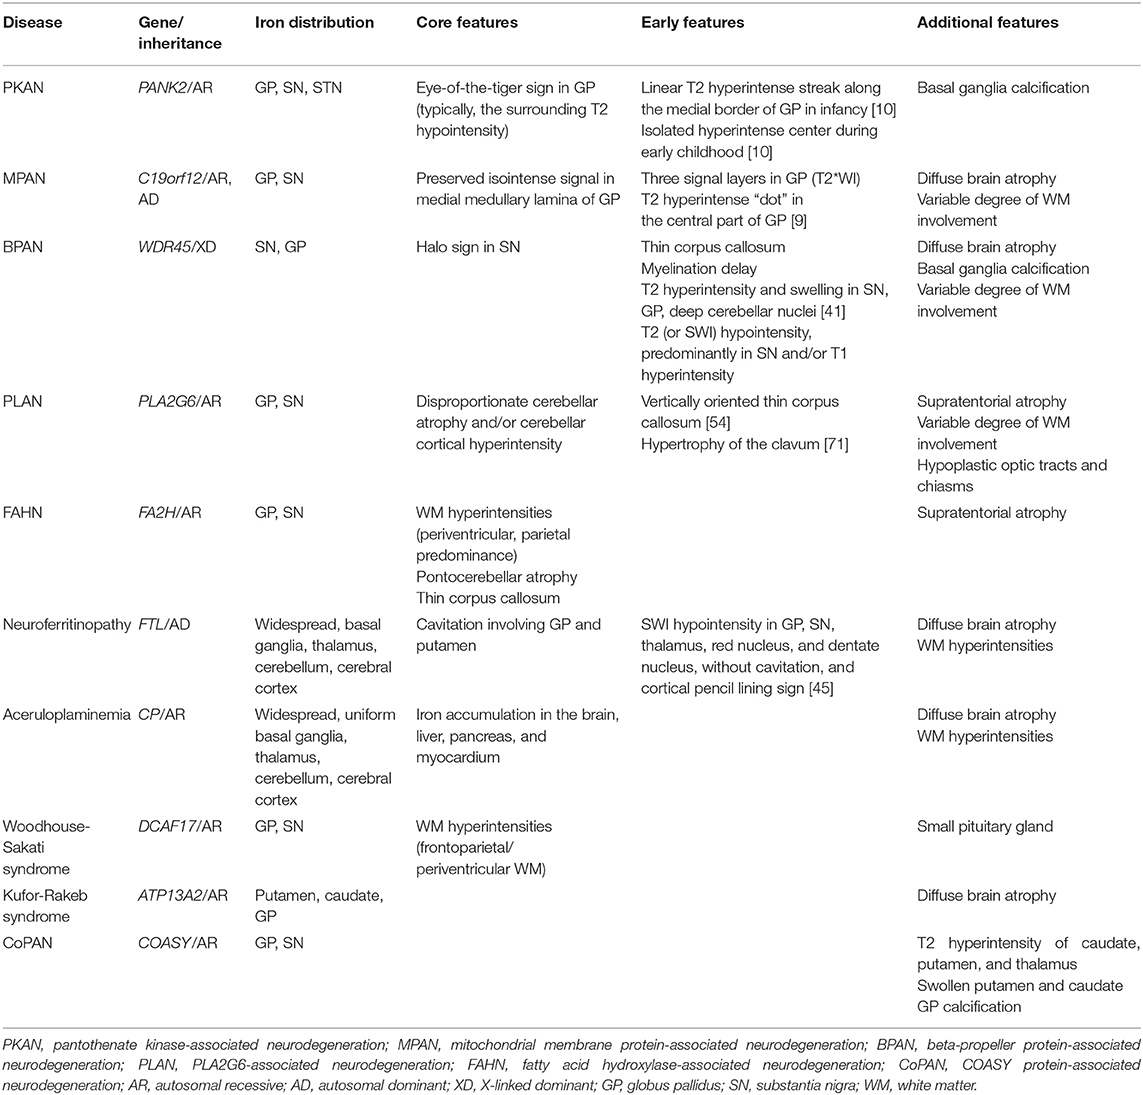
Table 1. MRI characteristics of NBIA subtypes.
Evidence by magnetic resonance imaging (MRI) of excessive brain iron indicates the possibility of NBIA. One established hallmark MRI feature of NBIA is the presence of T2 hypointense lesions in the GP and SN on T2-weighted images (T2WI) (3, 6). Certain MRI abnormalities may help distinguish among the NBIA disorders and facilitate more definitive diagnosis (1, 7). However, mutations in NBIA-related genes may not always lead to pronounced iron deposition (1, 7, 8). A significant number of patients confirmed to have an NBIA disorder by genetic testing have MRI features that are atypical for their specific disease (7, 9, 10). The appearance of specific MRI patterns depends on the stage of the disease and the patient's age at evaluation (1, 10), and evidence for iron accumulation may be absent or subtle early in the disease course. This phenomenon is particularly common in younger patients, where whole exome sequencing often leads to early diagnosis (3). Minor lesions visible in the early stages of disease and more extensive lesions in the late stages often are non-specific.
MRI interpretation can be challenging in rare brain diseases and can be limited by heterogeneously acquired MRI datasets, individual interpreter bias, and a lack of quantitative and longitudinal data. Therefore, optimal acquisition and interpretation of MRI data are needed to better define MRI phenotypes in the NBIA disorders. We describe here the evolution of MRI characteristics and provide a practical approach to identify NBIA subtypes.
Identification of Iron-Specific Basal Ganglia T2 Hypointensity
A routine brain MRI, without iron-sensitive sequences, is often suboptimal for evaluating for a possible NBIA disorder (7). Iron-sensitive sequences, especially susceptibility weighted imaging (SWI) and T2*-weighted imaging (T2*WI), can more clearly depict the increase and extent of iron deposition, even in small gray matter nuclei (10, 11). High-field strength MRI can detect iron with improved sensitivity (12).
To correctly diagnose abnormal brain iron accumulation, the interpreting physician should have a working knowledge of normal age-dependent signal hypointensities on MRI (7). The GP and SN normally become hypointense on T2WI around the end of the first decade of life when compared with signal in the adjacent normal-appearing white matter (13). Iron concentration in the basal ganglia increases with age. An “internal signal-intensity reference” that we empirically use to determine if iron is indeed increased over “normal” is to compare the GP and SN to the red nucleus (RN). They normally appear slightly more hypointense relative to the RN based on their higher iron content at all ages (14). If the signal in GP or SN is significantly more hypointense than in RN, then there is likely to be increased iron. To correct for inconsistencies in the reference standard, signal hypointensity can also be normalized by dividing the structure signal intensity by the mean signal intensity of the cerebrospinal fluid (15, 16).
Once T2 hypointensity is identified, iron-sensitive sequences should be reviewed to distinguish excessive iron deposition from other causes of T2 hypointensity. Hypointense basal ganglia have been observed in hypomyelinating leukodystrophy, lysosomal storage disorders, and other metal accumulation disorders (17). Due to the paramagnetic property of iron, the degree of signal loss is profoundly enhanced in iron-sensitive sequences. Manganese is also paramagnetic, and its deposition typically causes high signal intensity on T1WI (11). Although iron has a T1-shortening effect that can appear as high signal intensity on T1WI, the degree of T1 hyperintensity is variable and is influenced by the status of iron and T1WI parameters (11). Computed tomography (CT) scans may be more useful than MRI in differentiating calcifications from iron deposits. Basal ganglia calcification can co-exist with iron accumulation in NBIA cases, although its frequency is unknown (18–21).
Regional Distribution of Excessive Iron Accumulation
In most forms of NBIA, excessive iron deposition is mainly confined to the GP and SN (Table 1). Other iron-rich deep nuclei in the gray matter, like the dentate nucleus, can occasionally be affected to a lesser extent but only in specific NBIA disorders (22).
In PKAN, iron-related hypointense signals on SWI are restricted to the GP, SN, and subthalamic nucleus (STN) and the fiber tracts between these structures (10). In BPAN, the earliest and most intense iron deposition occurs in the SN as opposed to the GP, unlike PKAN and other NBIA disorders (7). Widespread brain iron accumulation involving the basal ganglia nuclei, thalami, dentate nuclei, and cerebral and cerebellar cortices may develop in aceruloplasminemia and neuroferritinopathy (7, 22). The symptom onset for both of these diseases has been described in adults (1). All basal ganglia and thalami are more uniformly involved in aceruloplasminemia (22). Cortical iron deposition appears as thin hypointense lines on SWI, referred to as pencil-lining in neuroferritinopathy (23, 24). Even in an asymptomatic mutation carrier for this autosomal dominant disease, a characteristic pattern of iron deposition can be seen on iron-sensitive sequences (25). Of the limited number of patients reported, only a small portion of cases with Kufor-Rakeb syndrome had iron accumulation within the putamen and caudate nuclei (26, 27).
Evolution of Pallidonigral Abnormalities
The characteristic pallidonigral lesions of the major NBIA disorders are established diagnostic clues (Table 1). These include the “eye-of-the-tiger” sign in PKAN, preservation of isointense signal in the medial medullary lamina in the GP of MPAN patients, the “halo” sign in the SN of BPAN patients, and “cavitation” in neuroferritinopathy. Other NBIA disorders do not have distinct pallidonigral lesions. However, the morphological patterns of pallidonigral lesions can vary according to the patient's age. Typical findings may not appear until adolescence or early adulthood and are therefore not usually useful in infancy or early childhood. For these reasons, the frequency of MRI clues varied across studies.
The detection of these specific MRI signs can also be influenced by MRI acquisition settings (10). Image planes and levels for optimal visualization should be selected for efficient identification of the signs (Figure 1).
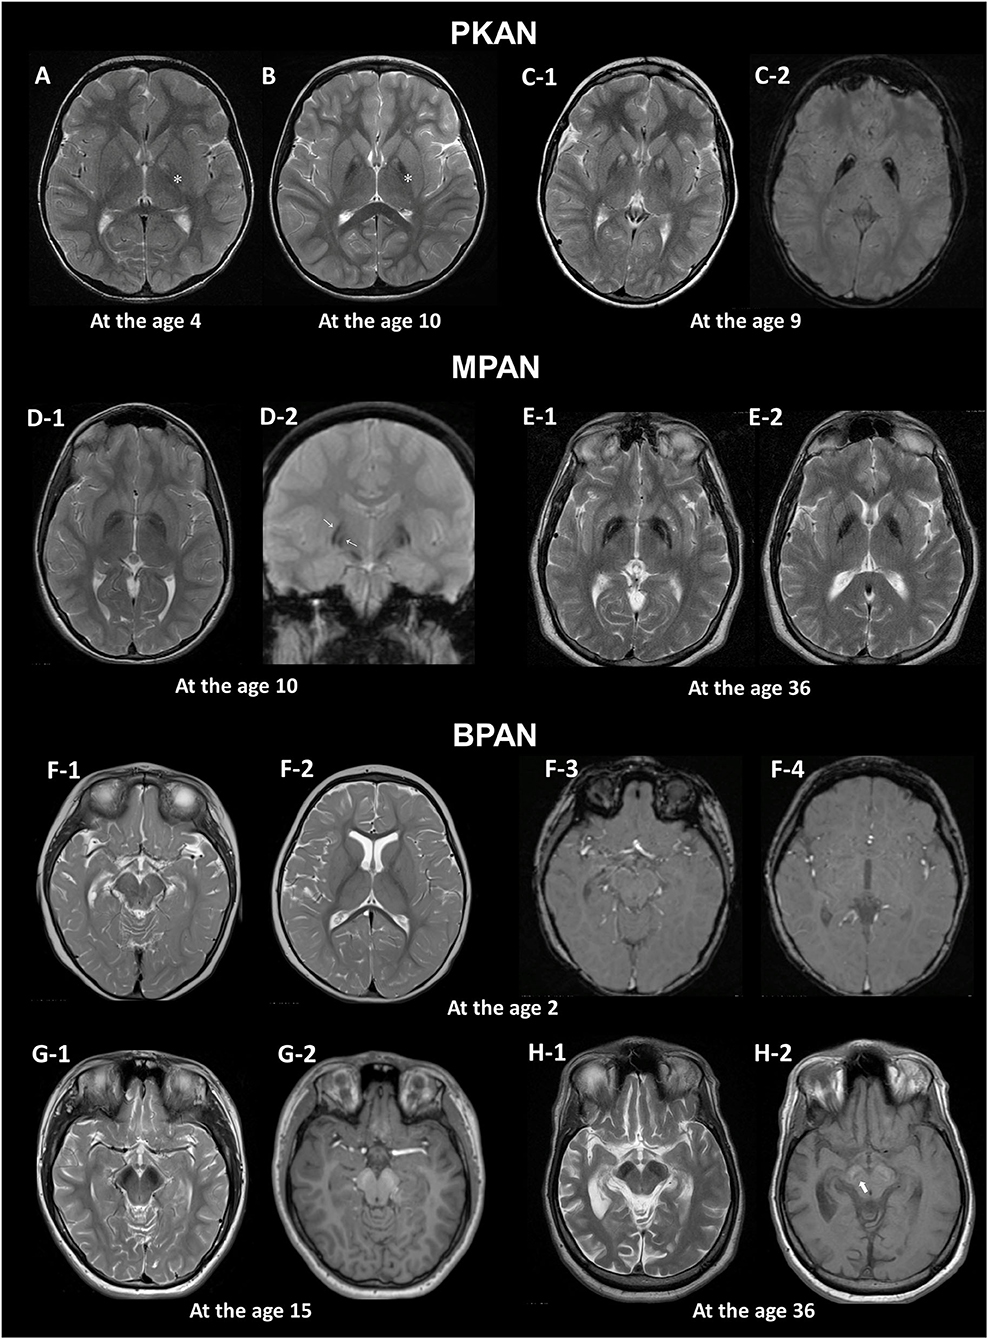
Figure 1. MRI hallmarks of PKAN (A–C), MPAN (D,E), and BPAN (F–H). In a PKAN patient with serial MRIs, the surrounding T2 hypointensity decreases in signal intensity with age (A,B, asterix). The PKAN-specific eye-of-the-tiger sign at the level of the anterior commissure (C-1) is better defined by the region-specific pattern of iron deposition on susceptibility-weighted image (C-2). In a younger patient with MPAN, T2- and T2*-weighted images shows preservation of isointense signal in the middle of inner and outer layers of iron accumulation (D-1, D-2, thin arrows). The typical streaking of the medial medullary lamina on T2-weighted image becomes more pronounced as signal intensity in the GP decreases, which is typically visible at the level of the anterior commissure (D-1, E-1). Brain MRI scans of three BPAN patients at different ages show age-related MRI changes. Brain MRI of a patient with BPAN at the age of 2 shows no abnormality on T2-weighted (F-1, F-2) and susceptibility-weighted (F-3, F-4) images. The substantia nigra is seen as hypointense on T2-weighted image (G-1, H-1) and hyperintense on T1-weighted image, whereas the central hypointense band is not demonstrated (G-2). T1-weighted image demonstrates hyperintensity of the substantia nigra and cerebral peduncle surrounding a central linear band of hypointensity, also known as the halo sign (H-2, thick arrow).
Eye-of-the-tiger Sign in PKAN
The hallmark of PKAN is the eye-of-the-tiger sign that comprises a round hyperintense center and surrounding hypointensity in the GP on T2WI. This sign in its classic form is not observed in other NBIA disorders, including in patients with COASY protein-associated neurodegeneration (CoPAN), which affects coenzyme A metabolism, similar to PKAN (21, 28).
The earliest change observed in infancy was the linear hyperintense streak along the medial border of the GP. During early childhood, T2WI mostly shows the isolated hyperintense center in the anteromedial region, which is typically visible at the level of the anterior commissure (29). The surrounding T2 hypointensity tends to increase in size and decrease in signal intensity with age (Figures 1A,B). Signal hypointensity on SWI was first detected in a 3-year-old patient, and advanced from the medial to the lateral portion of the GP (10, 18). In adult patients, the hyperintense center varies in shape, from small and round to streaked, or is lost entirely. Furthermore, the T2 hyperintense area of the sign may be obscured by diamagnetic calcium deposits (10, 18).
This sign has been reported to occur as an imaging phenocopy in other conditions, such as carbon monoxide intoxication, neuroferritinopathy, MPAN, Wilson's disease, multiple system atrophy, as well as in healthy adults (10, 30–32). The combination of T2 hypointense and hyperintense lesions, resulting from iron deposition and gliosis, respectively, can mimic the eye-of-the-tiger sign. The PKAN-specific eye-of-the-tiger sign is better defined by the region-specific pattern of iron deposition on SWI (10).
Preserved Isointense Signal in Medial Medullary Lamina in MPAN
Iron accumulation in the GP, followed by the SN, is evident on MRI (1). A characteristic feature in MPAN is T2 iso- to hyperintense streaking in the region of the medial medullary lamina between the abnormally hypointense GP interna and externa (33, 34), typically visible at the level of the anterior commissure (Figure 1). However, this MRI finding is present only in some MPAN patients (33, 35, 36). In recent reports, this sign was detectable in about half of patients and brain MRI may be normal in the early stages of MPAN (9, 37, 38).
Typical linear streaking (Figure 1E) develops over time and becomes more pronounced as signal intensity in the GP decreases due to iron accumulation. Initially, the GP appears as three signal layers consisting of the isointense signal layer in the middle of the hypointense inner and outer signal layers of iron accumulation, and is more contrasted on iron-sensitive T2*WI (Figure 1D).
Substantia Nigra Halo Sign in BPAN
A unique feature of BPAN is the presence of a hyperintense halo surrounding a central band of hypointensity on axial T1WI within the SN [Figure 1H; (19, 39, 40)]. T1 hyperintensity extends to the cerebral peduncles. T2WI shows prominent hypointense signal in the SN and cerebral peduncles. The SN is more hypointense relative to the GP, indicating higher levels of iron.
MRI changes in BPAN develop as age-dependent phenomena (Figures 1F–H). A serial MRI study demonstrated that SWI hypointensity in the GP and SN was observed after 2–7 years old, whereas T2 hypointensity after 4–7 years old (41). Here, the T1 hyperintense signal in the SN was detectable by early in the second decade of life (40, 42, 43). A characteristic halo sign appears later in the disease course, particularly as parkinsonism becomes evident in early adulthood (1).
Cavitation in Neuroferritinopathy
Cavitation involving the GP and putamen is unique to neuroferritinopathy among the NBIA disorders. A neuropathological study has demonstrated fluid accumulation within these cysts (22). Cavitary lesions with T2 hyperintensity are lined by hypointense rims secondary to prominent iron deposition (23). In a case report, Fluid-attenuated inversion recovery (FLAIR) images exhibited a tri-lamellar intensity consisting of an outer layer with iron deposition, a middle layer with gliosis, and a cystic core (44). This may represent different stages of expanding pathology. Cavitary lesions occur late in the disease, usually after excessive iron deposition, and evolve with time (22, 45).
Non-iron and Extrapallidal Abnormalities
Besides excessive iron, extrapallidal MRI abnormalities are helpful to facilitate diagnoses [Table 1; (7, 17)]. Neuroradiographic anatomic regions where non-iron and extrapallidal abnormalities are common in the NBIA disorders are summarized in Supplementary Figure 1.
The Extent and Magnitude of the Cerebral Atrophy
The extent of atrophy may depend on the nature of the underlying pathology (8, 46). Widespread α-synuclein-positive Lewy pathology has been identified in PLAN and MPAN (47, 48). Tau-positive neurofibrillary tangles are common in the brains of patients with BPAN (49). Indeed, pathologic α-synuclein and tau can spread extensively across the brain using a prion-like mechanism of propagation (50). Therefore, neurodegenerative changes can be more widely distributed throughout the brain. Serial MRI studies showed that brain atrophy progresses with the disease course (9, 34). On the contrary, in PKAN, neuronal loss, and astrogliosis are largely restricted to the GP in the absence of misfolded protein aggregates (49).
Visual rating scales are useful tools in assessing the severity of atrophy objectively. An established 4-point rating scale (51–53) is applicable for the assessment of cerebral and cerebellar cortical atrophy in NBIA disorders. In addition, planimetric analysis using sagittal T1WI can be used to evaluate volumetric changes in midsagittal structures including the corpus callosum, cerebellar vermis, and brainstem.
Disproportionate Cerebellar Atrophy in PLAN
In the majority of NBIA disorders, brain atrophy, if present, is usually generalized and has been commonly described without regional dominance. Cerebellar atrophy is a hallmark feature in PLAN, and is often the earliest sign on MRI (7, 54). It has been seen in up to 95% of patients with PLA2G6 mutations (55). In infantile neuroaxonal dystrophy (NAD) and childhood-onset PLAN (juvenile NAD), cerebellar atrophy is a near universal feature (56, 57). Patients with an earlier disease onset showed a more severe cerebellar atrophy, which was assessed using the ratio of the mid-sagittal vermis size over the total posterior cranial fossa size (57). T2 or FLAIR hyperintensity in the cerebellar cortex often accompanies cerebellar atrophy (54, 58). In contrast, excessive iron deposition in the GP is seen in only up to half of PLAN cases (7, 55). Disproportionate cerebellar atrophy and iron deposition can be absent in adult-onset PLAN (56, 59, 60), where there may be only frontally predominant atrophy (61) and MRI may even appear normal (56).
Thin Corpus Callosum
Thinning of the corpus callosum is a uniform feature in fatty acid hydroxylase-associated neurodegeneration (FAHN) (7, 62). Abnormal posterior corpus callosum that are thin and vertically oriented were noted in some cases of PLAN (54). Corpus callosum thinning may be an early sign of BPAN in the absence of excessive iron during infancy and early childhood (39, 40, 63).
It is important to evaluate the thickness and the morphology of corpus callosum in association with other findings observed in NBIA disorders, such as cerebral atrophy, myelination defect, or white matter damage (64).
White Matter Hyperintensities
T2 hyperintensities in white matter have been reported in most NBIA subtypes (1, 7, 8, 17) and are prominent in FAHN, Woodhouse-Sakati syndrome (WSS), and aceruloplasminemia. In a large cohort of patients with FAHN, the most common findings were white matter changes (100%), followed by ponto-cerebellar atrophy, GP hypointensity, and thin corpus callosum (62). T2 hyperintense white matter abnormalities were consistently found in the periventricular white matter with parietal predominance. In WSS, frontoparietal and periventricular white matter lesions were the most common non-iron abnormalities (65). And, older age was associated with a more severe degree of white matter lesions. In this study, the extent of white matter lesions was graded as none, mild (small focal), moderate (patchy scattered), or severe (diffuse confluent) according to their site, shape, confluency, and multifocality (65, 66). Prominent white matter hyperintensity is frequently noted in aceruloplasminemia (7). White matter hyperintensities in the posterior frontal and parieto-occipital regions extend caudally to the brainstem along the corticospinal tracts in a patient with aceruloplasminemia (67). Confluent T2 hyperintensities in white matter, localized mostly to the periventricular region, may be observed to a lesser extent in MPAN, BPAN, PLAN, and neuroferritinopathy (7–9, 40).
Although white matter T2 hyperintensity may be observed in NBIA disorders, diffuse cerebral hypomyelination is generally not a feature of these disorders (17). Delayed myelination has been reported in some cases of BPAN diagnosed in infancy and childhood (63, 68). However, the MRI findings in these cases were not described in enough detail to assess myelination. Hypomyelination is defined as an unchanged pattern of deficient myelination on two successive MRI scans at least 6 months apart in a child older than 1 year (69, 70). Myelinated white matter structures have a higher signal than do gray matter structures on T1WI and a lower signal on T2WI (69).
Miscellaneous Findings
Apparent hypertrophy of the clavum has been proposed as an important early feature of PLAN and may precede cerebellar atrophy (57, 71). Confirmation of clavum enlargement was made by comparison of its largest anteroposterior dimension on mid-sagittal T1WI with age-matched controls (71). Hypoplastic optic tracts and chiasms are seen in infantile NAD (72). SN swelling in the absence of iron deposition has been described as an early sign of BPAN (73), although the reason for SN enlargement is unknown. In a serial MRI study, transient T2 hyperintensity and swelling in the SN, GP, and/or deep cerebellar nuclei was observed during the episodes of pyrexia and seizures (41). Similarly, swelling and T2 hyperintensity of the caudate nucleus, putamen, and thalamus have been found in CoPAN (28). Small pituitary glands are common MRI abnormalities in WSS (65).
Current Limitations and Future Directions
Visual inspection of MRI can be highly subjective, and results can be varied. Objective interpretation is limited due to a lack of consistent methods to quantify the severity of MRI findings. A feasible way to objectively assess MRI severity is to use established visual rating scales or planimetric analysis as described above.
Iron quantification can be challenging, particularly within routine clinical settings. T2WI and SWI do not directly reflect iron concentrations (74). Instead, both the transverse relaxation rate (R2*) and quantitative susceptibility mapping are highly sensitive and accurate for measuring iron content in the brain (75). In a recent randomized trial of deferiprone for PKAN, iron concentrations in the GP were measured by MRI-R2* mapping (76). Diffusion-tensor imaging study demonstrated a significant increase of FA in patients with PKAN suggest the presence of abnormal iron in deep gray matter nuclei, even in the absence of its demonstration on T2*WI (77). An optimized protocol for quantitative MRI analysis is needed to monitor disease progression and treatment response.
Finally, studies that have investigated the pathological correlates of MRI signal alterations are rare. In some NBIA disorders, excessive iron deposition has not yet been demonstrated pathologically due to lack of autopsy-proven cases. Further research is needed to verify the exact underlying pathology of MRI abnormalities.
Conclusion
Specific NBIA disorders can be diagnosed by identifying characteristic MRI changes in combination with clinical findings. If an NBIA disorder is suspected or in the differential diagnosis, then iron-sensitive sequences should be included in an initial MRI. It is important to consider that MRI features specific to each NBIA disorder develop in an age-dependent manner and evolve during the disease course. The stepwise pattern-recognition approach outlined here may help to distinguish specific NBIA disorders as well as to delineate the natural course of MRI changes.
Author Contributions
J-HL and SH: design and conceptualization of the study, analysis and interpretation of the data, drafting the manuscript, and final approval of the manuscript. PH: design and conceptualization of the study and final approval of the manuscript. AG and JY: acquisition of the data and final approval of the manuscript. All authors reviewed the manuscript.
Funding
This study was supported by Research Institute for Convergence of biomedical science and technology Grant No. (30-2018-009), Pusan National University Yangsan Hospital.
Conflict of Interest
The authors declare that the research was conducted in the absence of any commercial or financial relationships that could be construed as a potential conflict of interest.
Supplementary Material
The Supplementary Material for this article can be found online at: https://www.frontiersin.org/articles/10.3389/fneur.2020.01024/full#supplementary-material
Supplementary Figure 1. Neuroradiographic anatomic regions where non-iron and extrapallidal abnormalities are common in the NBIA disorders. A normal MRI is used to show structures. The specific NBIA disorders are listed under each abnormality.
References
1. Hogarth P. Neurodegeneration with brain iron accumulation: diagnosis and management. J Mov Disord. (2015) 8:1–13. doi: 10.14802/jmd.14034
2. Meyer E, Kurian MA, Hayflick SJ. Neurodegeneration with brain iron accumulation: genetic diversity and pathophysiological mechanisms. Annu Rev Genomics Hum Genet. (2015) 16:257–79. doi: 10.1146/annurev-genom-090314-025011
3. Hayflick SJ, Kurian MA, Hogarth P. Neurodegeneration with brain iron accumulation. Handb Clin Neurol. (2018) 147:293–305. doi: 10.1016/B978-0-444-63233-3.00019-1
4. Levi S, Tiranti V. Neurodegeneration with brain iron accumulation disorders: valuable models aimed at understanding the pathogenesis of iron deposition. Pharmaceuticals. (2019) 12:27. doi: 10.3390/ph12010027
5. Tello C, Darling A, Lupo V, Pérez-Dueñas B, Espinós C. On the complexity of clinical and molecular bases of neurodegeneration with brain iron accumulation. Clin Genet. (2018) 93:731–40. doi: 10.1111/cge.13057
6. Keogh MJ, Chinnery PF. Current concepts and controversies in neurodegeneration with brain iron accumulation. Semin Pediatr Neurol. (2012) 19:51–6. doi: 10.1016/j.spen.2012.03.004
7. Amaral LL, Gaddikeri S, Chapman PR, Roy R, Gaddikeri RS, Marussi VH, et al. Neurodegeneration with brain iron accumulation: clinicoradiological approach to diagnosis. J Neuroimaging. (2015) 25:539–51. doi: 10.1111/jon.12195
8. Kruer MC, Boddaert N, Schneider SA, Houlden H, Bhatia KP, Gregory A, et al. Neuroimaging features of neurodegeneration with brain iron accumulation. Am J Neuroradiol. (2012) 33:407–14. doi: 10.3174/ajnr.A2677
9. Skowronska M, Kmiec T, Jurkiewicz E, Malczyk K, Kurkowska-Jastrzebska I, Czlonkowska A. Evolution and novel radiological changes of neurodegeneration associated with mutations in C19orf12. Parkinsonism Relat Disord. (2017) 39:71–6. doi: 10.1016/j.parkreldis.2017.03.013
10. Lee JH, Gregory A, Hogarth P, Rogers C, Hayflick SJ. Looking deep into the eye-of-the-tiger in pantothenate kinase-associated neurodegeneration. Am J Neuroradiol. (2018) 39:583–8. doi: 10.3174/ajnr.A5514
11. Kanda T, Nakai Y, Aoki S, Oba H, Toyoda K, Kitajima K, et al. Contribution of metals to brain MR signal intensity: review articles. Jpn J Radiol. (2016) 34:258–66. doi: 10.1007/s11604-016-0532-8
12. Dusek P, Mekle R, Skowronska M, Acosta-Cabronero J, Huelnhagen T, Robinson SD, et al. Brain iron and metabolic abnormalities in C19orf12 mutation carriers: a 7.0 tesla MRI study in mitochondrial membrane protein-associated neurodegeneration. Mov Disord. (2020) 35:142–50. doi: 10.1002/mds.27827
13. Barkovich AJ. Pediatric Neuroimaging. 4th ed. Philadelphia, PA: Lippincott Williams and Wilkins (2005). p. 17–75.
14. Yan SQ, Sun JZ, Yan YQ, Wang H, Lou M. Evaluation of brain iron content based on magnetic resonance imaging (MRI): comparison among phase value, R2* and magnitude signal intensity. PLoS ONE. (2012) 7:e31748. doi: 10.1371/journal.pone.0031748
15. Zhang Y, Zabad R, Wei X, Metz L, Hill M, Mitchell J. Deep grey matter “black T2” on 3 tesla magnetic resonance imaging correlates with disability in multiple sclerosis. Mult Scler. (2007) 13:880–3. doi: 10.1177/1352458507076411
16. Gupta D, Saini J, Kesavadas C, Sarma PS, Kishore A. Utility of susceptibility-weighted MRI in differentiating Parkinson's disease and atypical parkinsonism. Neuroradiology. (2010) 52:1087–94. doi: 10.1007/s00234-010-0677-6
17. Kruer MC, Boddaert N. Neurodegeneration with brain iron accumulation: a diagnostic algorithm. Semin Pediatr Neurol. (2012) 19:67–74. doi: 10.1016/j.spen.2012.04.001
18. Wu YW, Hess CP, Singhal NS, Groden C, Toro C. Idiopathic basal ganglia calcifications: an atypical presentation of PKAN. Pediatr Neurol. (2013) 49:351–4. doi: 10.1016/j.pediatrneurol.2013.06.021
19. Saitsu H, Nishimura T, Muramatsu K, Kodera H, Kumada S, Sugai K, et al. De novo mutations in the autophagy gene WDR45 cause static encephalopathy of childhood with neurodegeneration in adulthood. Nat Genet. (2013) 45:445–9. doi: 10.1038/ng.2562
20. Van Goethem G, Livingston JH, Warren D, Oojageer AJ, Rice GI, Crow YJ. Basal ganglia calcification in a patient with beta-propeller protein-associated neurodegeneration. Pediatr Neurol. (2014) 51:843–5. doi: 10.1016/j.pediatrneurol.2014.08.017
21. Dusi S, Valletta L, Haack TB, Tsuchiya Y, Venco P, Pasqualato S, et al. Exome sequence reveals mutations in CoA synthase as a cause of neurodegeneration with brain iron accumulation. Am J Hum Genet. (2014) 94:11–22. doi: 10.1016/j.ajhg.2013.11.008
22. McNeill A, Birchall D, Hayflick SJ, Gregory A, Schenk JF, Zimmerman EA, et al. T2* and FSE MRI distinguishes four subtypes of neurodegeneration with brain iron accumulation. Neurology. (2008) 70:1614–9. doi: 10.1212/01.wnl.0000310985.40011.d6
23. Kumar N, Rizek P, Jog M. Neuroferritinopathy: pathophysiology, presentation, differential diagnoses and management. Tremor Other Hyperkinet Mov. (2016) 6:355. doi: 10.7916/D8KK9BHF
24. Batla A, Adams ME, Erro R, Ganos C, Balint B, Mencacci NE, et al. Cortical pencil lining in neuroferritinopathy: a diagnostic clue. Neurology. (2015) 84:1816–8. doi: 10.1212/WNL.0000000000001511
25. Chinnery PF, Crompton DE, Birchall D, Jackson MJ, Coulthard A, Lombès A, et al. Clinical features and natural history of neuroferritinopathy caused by the FTL1 460InsA mutation. Brain. (2007) 130:110–9. doi: 10.1093/brain/awl319
26. Schneider SA, Paisan-Ruiz C, Quinn NP, Lees AJ, Houlden H, Hardy J, et al. ATP13A2 mutations (PARK9) cause neurodegeneration with brain iron accumulation. Mov Disord. (2010) 25:979–84. doi: 10.1002/mds.22947
27. Gregory A, Hayflick S. Neurodegeneration with brain iron accumulation disorders overview. In: Adam MP, Ardinger HH, Pagon RA, Wallace SE, Bean LJH, Stephens K, Amemiya A, editors. GeneReviews®. Seattle, WA: University of Washington (2019).
28. Evers C, Seitz A, Assmann B, Opladen T, Karch S, Hinderhofer K, et al. Diagnosis of CoPAN by whole exome sequencing: waking up a sleeping tiger's eye. Am J Med Genet A. (2017) 173:1878–86. doi: 10.1002/ajmg.a.38252
29. Hayflick SJ, Hartman M, Coryell J, Gitschier J, Rowley H. Brain MRI in neurodegeneration with brain iron accumulation with and without PANK2 mutations. Am J Neuroradiol. (2006) 27:1230–3.
30. Yoganathan S, Sudhakar SV, Thomas M, Dutta AK, Danda S. “Eye of tiger sign” mimic in an adolescent boy with mitochondrial membrane protein associated neurodegeneration (MPAN). Brain Dev. (2016) 38:516–9. doi: 10.1016/j.braindev.2015.10.017
31. Litwin T, Karlinski M, Skowrońska M, Dziezyc K, Gołebiowski M, Członkowska A. MR image mimicking the “eye of the tiger” sign in Wilson's disease. J Neurol. (2014) 261:1025–7. doi: 10.1007/s00415-014-7322-y
32. Chang MH, Hung WL, Liao YC, Lee YC, Hsieh PF. Eye of the tiger-like MRI in parkinsonian variant of multiple system atrophy. J Neural Transm. (2009) 116:861–6. doi: 10.1007/s00702-009-0234-9
33. Hogarth P, Gregory A, Kruer MC, Sanford L, Wagoner W, Natowicz MR, et al. New NBIA subtype: genetic, clinical, pathologic, and radiographic features of MPAN. Neurology. (2013) 80:268–75. doi: 10.1212/WNL.0b013e31827e07be
34. Gregory A, Hartig M, Prokisch H, Kmiec T, Hogarth P, Hayflick SJ. Mitochondrial membrane protein-associated neurodegeneration. In: Adam MP, Ardinger HH, Pagon RA, Wallace SE, Bean LJH, Stephens K, Amemiya A, editors. GeneReviews®. Seattle, WA: University of Washington (2019).
35. Hartig M, Prokisch H, Meitinger T, Klopstock T. Mitochondrial membrane protein-associated neurodegeneration (MPAN). Int Rev Neurobiol. (2013) 110:73–84. doi: 10.1016/B978-0-12-410502-7.00004-1
36. Deutschländer A, Konno T, Ross OA. Mitochondrial membrane protein-associated neurodegeneration. Parkinsonism Relat Disord. (2017) 39:1–3. doi: 10.1016/j.parkreldis.2017.03.014
37. Olgiati S, Dogu O, Tufekcioglu Z, Diler Y, Saka E, Gultekin M, et al. The p.Thr11Met mutation in c19orf12 is frequent among adult Turkish patients with MPAN. Parkinsonism Relat Disord. (2017) 39:64–70. doi: 10.1016/j.parkreldis.2017.03.012
38. Landouré G, Zhu PP, Lourenço CM, Johnson JO, Toro C, Bricceno KV, et al. Hereditary spastic paraplegia type 43 (SPG43) is caused by mutation in C19orf12. Hum Mutat. (2013) 34:1357–60. doi: 10.1002/humu.22378
39. Gregory A, Kurian MA, Haack T, Hayflick SJ, Hogarth P. Beta-propeller protein-associated neurodegeneration. In: Adam MP, Ardinger HH, Pagon RA, Wallace SE, Bean LJH, Stephens K, Amemiya A, editors. GeneReviews®. Seattle, WA: University of Washington (2017).
40. Hayflick SJ, Kruer MC, Gregory A, Haack TB, Kurian MA, Houlden HH, et al. β-Propeller protein-associated neurodegeneration: a new X-linked dominant disorder with brain iron accumulation. Brain. (2013) 136:1708–17. doi: 10.1093/brain/awt095
41. Kimura Y, Sato N, Ishiyama A, Shigemoto Y, Suzuki F, Fujii H, et al. Serial MRI alterations of pediatric patients with beta-propeller protein associated neurodegeneration (BPAN). J Neuroradiol. (2020). doi: 10.1016/j.neurad.2020.04.002. [Epub ahead of print].
42. Ohba C, Nabatame S, Iijima Y, Nishiyama K, Tsurusaki Y, Nakashima M, et al. De novo WDR45 mutation in a patient showing clinically Rett syndrome with childhood iron deposition in brain. J Hum Genet. (2014) 59:292–5. doi: 10.1038/jhg.2014.18
43. Long M, Abdeen N, Geraghty MT, Hogarth P, Hayflick S, Venkateswaran S. Novel WDR45 mutation and pathognomonic BPAN imaging in a young female with mild cognitive delay. Pediatrics. (2015) 136:e714–17. doi: 10.1542/peds.2015-0750
44. Yoon SH, Kim NY, Kim YJ, Lyoo CH. Novel ferritin light chain gene mutation in a korean patient with neuroferritinopathy. J Mov Disord. (2019) 12:63–5. doi: 10.14802/jmd.18062
45. Park CW, Kim NY, Kim YJ, Song SK, Lyoo CH. A patient with neuroferritinopathy presenting with juvenile-onset voice tremor. J Mov Disord. (2019) 13:66–8. doi: 10.14802/jmd.19038
46. Kara E, Hardy J, Houlden H. The pallidopyramidal syndromes: nosology, aetiology and pathogenesis. Curr Opin Neurol. (2013) 26:381–94. doi: 10.1097/WCO.0b013e3283632e83
47. Schneider SA, Hardy J, Bhatia KP. Syndromes of neurodegeneration with brain iron accumulation (NBIA): an update on clinical presentations, histological and genetic underpinnings, and treatment considerations. Mov Disord. (2012) 27:42–53. doi: 10.1002/mds.23971
48. Schneider SA, Alcalay RN. Neuropathology of genetic synucleinopathies with parkinsonism: review of the literature. Mov Disord. (2017) 32:1504–23. doi: 10.1002/mds.27193
49. Arber CE, Li A, Houlden H, Wray S. Review: insights into molecular mechanisms of disease in neurodegeneration with brain iron accumulation: unifying theories. Neuropathol Appl Neurobiol. (2016) 42:220–41. doi: 10.1111/nan.12242
50. Goedert M, Masuda-Suzukake M, Falcon B. Like prions: the propagation of aggregated tau and α-synuclein in neurodegeneration. Brain. (2017) 140:266–78. doi: 10.1093/brain/aww230
51. Pasquier F, Leys D, Weerts JG, Mounier-Vehier F, Barkhof F, Scheltens P. Inter- and intraobserver reproducibility of cerebral atrophy assessment on MRI scans with hemispheric infarcts. Eur Neurol. (1996) 36:268–72. doi: 10.1159/000117270
52. Harper L, Barkhof F, Fox NC, Schott JM. Using visual rating to diagnose dementia: a critical evaluation of MRI atrophy scales. J Neurol Neurosurg Psychiatry. (2015) 86:1225–33. doi: 10.1136/jnnp-2014-310090
53. Sasaki R, Maki F, Hara D, Tanaka S, Hasegawa Y. Stratification of disease progression in a broad spectrum of degenerative cerebellar ataxias with a clustering method using MRI-based atrophy rates of brain structures. Cerebellum Ataxias. (2017) 4:9. doi: 10.1186/s40673-017-0068-4
54. Kurian MA, Morgan NV, MacPherson L, Foster K, Peake D, Gupta R, et al. Phenotypic spectrum of neurodegeneration associated with mutations in the PLA2G6 gene (PLAN). Neurology. (2008) 70:1623–9. doi: 10.1212/01.wnl.0000310986.48286.8e
55. Gregory A, Westaway SK, Holm IE, Kotzbauer PT, Hogarth P, Sonek S, et al. Neurodegeneration associated with genetic defects in phospholipase A2. Neurology. (2008) 71:1402–9. doi: 10.1212/01.wnl.0000327094.67726.28
56. Kurian MA, McNeill A, Lin JP, Maher ER. Childhood disorders of neurodegeneration with brain iron accumulation (NBIA). Dev Med Child Neurol. (2011) 53:394–404. doi: 10.1111/j.1469-8749.2011.03955.x
57. Darling A, Aguilera-Albesa S, Tello CA, Serrano M, Tomás M, Camino-León R, et al. PLA2G6-associated neurodegeneration: new insights into brain abnormalities and disease progression. Parkinsonism Relat Disord. (2019) 61:179–86. doi: 10.1016/j.parkreldis.2018.10.013
58. Iodice A, Spagnoli C, Salerno GG, Frattini D, Bertani G, Bergonzini P, et al. Infantile neuroaxonal dystrophy and PLA2G6-associated neurodegeneration: an update for the diagnosis. Brain Dev. (2017) 39:93–100. doi: 10.1016/j.braindev.2016.08.012
59. Karkheiran S, Shahidi GA, Walker RH, Paisán-Ruiz C. PLA2G6-associated dystonia-parkinsonism: case report and literature review. Tremor Other Hyperkinet Mov. (2015) 5:317. doi: 10.7916/D84Q7T4W
60. Guo YP, Tang BS, Guo JF. PLA2G6-associated neurodegeneration (PLAN): review of clinical phenotypes and genotypes. Front Neurol. (2018) 9:1100. doi: 10.3389/fneur.2018.01100
61. Yoshino H, Tomiyama H, Tachibana N, Ogaki K, Li Y, Funayama M, et al. Phenotypic spectrum of patients with PLA2G6 mutation and PARK14-linked parkinsonism. Neurology. (2010) 75:1356–61. doi: 10.1212/WNL.0b013e3181f73649
62. Rattay TW, Lindig T, Baets J, Smets K, Deconinck T, Söhn AS, et al. FAHN/SPG35: a narrow phenotypic spectrum across disease classifications. Brain. (2019) 142:1561–72. doi: 10.1093/brain/awz102
63. Hoffjan S, Ibisler A, Tschentscher A, Dekomien G, Bidinost C, Rosa AL. WDR45 mutations in Rett (-like) syndrome and developmental delay: case report and an appraisal of the literature. Mol Cell Probes. (2016) 30:44–9. doi: 10.1016/j.mcp.2016.01.003
64. Andronikou S, Pillay T, Gabuza L, Mahomed N, Naidoo J, Hlabangana LT, et al. Corpus callosum thickness in children: an MR pattern-recognition approach on the midsagittal image. Pediatr Radiol. (2015) 45:258–72. doi: 10.1007/s00247-014-2998-9
65. Abusrair AH, Bohlega S, Al-Semari A, Al-Ajlan FS, Al-Ahmadi K, Mohamed B, et al. Brain MR imaging findings in Woodhouse-Sakati syndrome. Am J Neuroradiol. (2018) 39:2256–62. doi: 10.3174/ajnr.A5879
66. King KS, Peshock RM, Warren MW, Alhilali L, Hulsey K, McColl R, et al. Evaluation of a practical visual MRI rating scale of brain white matter hyperintensities for clinicians based on largest lesion size regardless of location. Am J Neuroradiol. (2013) 34:797–801. doi: 10.3174/ajnr.A3283
67. Grisoli M, Piperno A, Chiapparini L, Mariani R, Savoiardo M. MR imaging of cerebral cortical involvement in aceruloplasminemia. Am J Neuroradiol. (2005) 26:657–61.
68. Stige KE, Gjerde IO, Houge G, Knappskog PM, Tzoulis C. Beta-propeller protein-associated neurodegeneration: a case report and review of the literature. Clin Case Rep. (2018) 6:353–62. doi: 10.1002/ccr3.1358
69. Guleria S, Kelly TG. Myelin, myelination, and corresponding magnetic resonance imaging changes. Radiol Clin North Am. (2014) 52:227–39. doi: 10.1016/j.rcl.2013.11.009
70. Schiffmann R, van der Knaap MS. Invited article: an MRI-based approach to the diagnosis of white matter disorders. Neurology. (2009) 72:750–9. doi: 10.1212/01.wnl.0000343049.00540.c8
71. Al-Maawali A, Yoon G, Feigenbaum AS, Halliday WC, Clarke JT, Branson HM, et al. Validation of the finding of hypertrophy of the clava in infantile neuroaxonal dystrophy/PLA2G6 by biometric analysis. Neuroradiology. (2016) 58:1035–42. doi: 10.1007/s00234-016-1726-6
72. Illingworth MA, Meyer E, Chong WK, Manzur AY, Carr LJ, Younis R, et al. PLA2G6-associated neurodegeneration (PLAN): further expansion of the clinical, radiological and mutation spectrum associated with infantile and atypical childhood-onset disease. Mol Genet Metab. (2014) 112:183–9. doi: 10.1016/j.ymgme.2014.03.008
73. Russo C, Ardissone A, Freri E, Gasperini S, Moscatelli M, Zorzi G, et al. Substantia nigra swelling and dentate nucleus T2 hyperintensity may be early magnetic resonance imaging signs of β-propeller protein-associated neurodegeneration. Mov Disord Clin Pract. (2018) 6:51–6. doi: 10.1002/mdc3.12693
74. Stüber C, Pitt D, Wang Y. Iron in multiple sclerosis and its noninvasive imaging with quantitative susceptibility mapping. Int J Mol Sci. (2016) 17:100. doi: 10.3390/ijms17010100
75. Lee JH, Lee MS. Brain iron accumulation in atypical parkinsonian syndromes: in vivo MRI evidences for distinctive patterns. Front Neurol. (2019) 10:74. doi: 10.3389/fneur.2019.00074
76. Klopstock T, Tricta F, Neumayr L, Karin I, Zorzi G, Fradette C, et al. Safety and efficacy of deferiprone for pantothenate kinase-associated neurodegeneration: a randomised, double-blind, controlled trial and an open-label extension study. Lancet Neurol. (2019) 18:631–42. doi: 10.1016/S1474-4422(19)30142-5
Keywords: neurodegeneration, iron, NBIA, magnetic resonance imaging, pattern
Citation: Lee J-H, Yun JY, Gregory A, Hogarth P and Hayflick SJ (2020) Brain MRI Pattern Recognition in Neurodegeneration With Brain Iron Accumulation. Front. Neurol. 11:1024. doi: 10.3389/fneur.2020.01024
Received: 25 May 2020; Accepted: 05 August 2020;
Published: 10 September 2020.
Edited by:
Nobutaka Hattori, Juntendo University, JapanReviewed by:
Luca Marsili, University of Cincinnati, United StatesCarlos Raúl Ferreira, National Human Genome Research Institute (NHGRI), United States
Copyright © 2020 Lee, Yun, Gregory, Hogarth and Hayflick. This is an open-access article distributed under the terms of the Creative Commons Attribution License (CC BY). The use, distribution or reproduction in other forums is permitted, provided the original author(s) and the copyright owner(s) are credited and that the original publication in this journal is cited, in accordance with accepted academic practice. No use, distribution or reproduction is permitted which does not comply with these terms.
*Correspondence: Susan J. Hayflick, hayflick@ohsu.edu